Learn how the Super Trend Indicator works, how to identify buy and sell signals, choose the best settings, and use it to make smarter trading decisions.
Introduction
Imagine standing at the edge of a busy highway, trying to cross without knowing which direction the traffic is moving. You might take a few steps forward, hesitate, and then retreat as vehicles rush past. Trading without understanding the market trend feels remarkably similar. Every buy or sell decision becomes a gamble because you are reacting to price movements instead of understanding their direction.
One of the biggest challenges every trader faces is answering a deceptively simple question: Is the market trending, or is it simply moving randomly? Many beginners enter trades based on emotions, news headlines, or tips from social media, only to watch the market move against them. Experienced traders, however, know that identifying the prevailing trend before taking a position dramatically improves the odds of success.
This is where the Super Trend Indicator becomes invaluable. Known for its simplicity and visual clarity, it helps traders identify trends, spot potential entry and exit points, and manage risk more effectively. Unlike many technical indicators that overwhelm beginners with complex calculations and multiple signals, the Super Trend Indicator presents market direction in an intuitive way that is easy to interpret yet powerful enough for experienced traders.
In this comprehensive guide, you will learn not only how the Super Trend Indicator works but also why it works, when it performs best, where it falls short, and how professional traders incorporate it into a disciplined trading strategy. By the end, you will have the knowledge to use this indicator confidently rather than treating it as a magic formula.
Table of Contents
Part I – Understanding the Basics
What Is the Super Trend Indicator?
Every successful trading strategy begins with understanding the tools behind it. Before placing your first trade using the Super Trend Indicator, it is essential to know what it is, why it was developed, and what problem it solves.
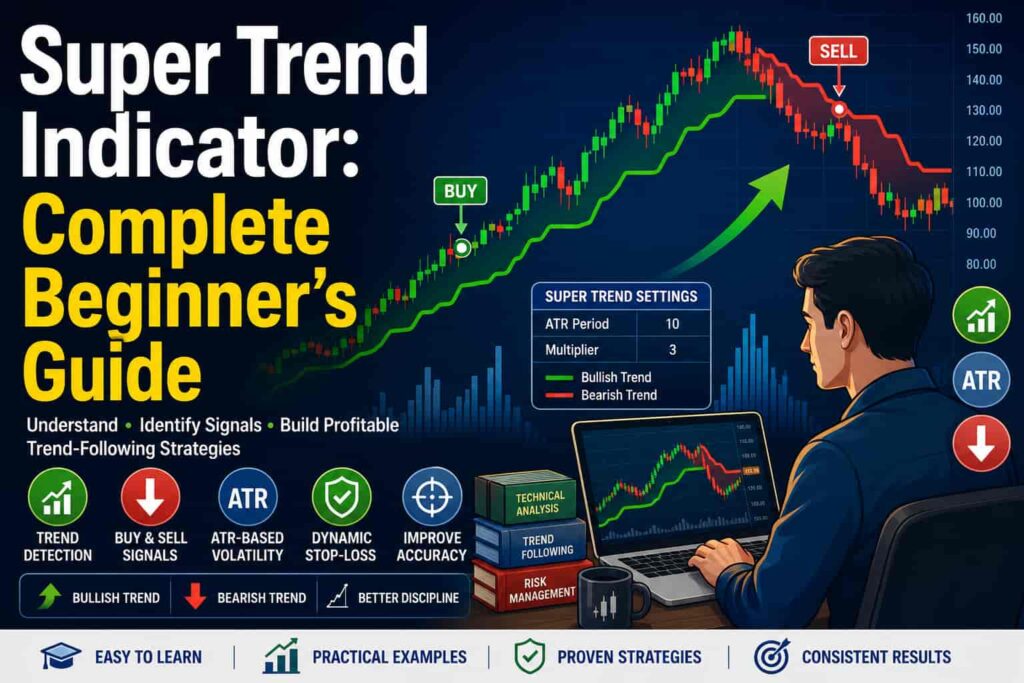
At its core, the Super Trend Indicator is a trend-following technical analysis tool designed to help traders determine the current direction of the market. It overlays directly on the price chart and dynamically shifts between bullish and bearish zones based on price action and market volatility. When the trend changes, the indicator flips from above the price to below it, or vice versa, making trend reversals visually obvious.
Unlike oscillators that fluctuate within a fixed range, the Super Trend Indicator follows price itself. This makes it particularly useful for traders who want a straightforward way to identify whether buyers or sellers are currently in control.
Why Was It Created?
Financial markets rarely move in straight lines. Prices constantly fluctuate due to news, investor sentiment, institutional activity, and countless other factors. Amid this noise, traders need a way to distinguish genuine trends from temporary fluctuations.
The Super Trend Indicator was designed to simplify this challenge by combining:
- Price movement
- Market volatility
- Trend direction
into a single visual indicator.
Instead of forcing traders to analyze several separate indicators, it condenses this information into one easy-to-read line.
Why Traders Like It
The popularity of the Super Trend Indicator stems from several practical advantages:
- It is easy to understand, even for beginners.
- It clearly highlights bullish and bearish trends.
- It provides potential entry and exit signals.
- It can serve as a dynamic trailing stop-loss.
- It adapts automatically to changing market volatility.
Many charting platforms also include it as a built-in indicator, making it accessible without requiring custom coding or advanced technical knowledge.
Is It a Prediction Tool?
One of the biggest misconceptions about the Super Trend Indicator is that it predicts future prices.
It does not.
Instead, it reacts to existing price movement and volatility to indicate the most probable direction of the prevailing trend. Like every trend-following indicator, it is designed to keep traders aligned with sustained market moves rather than forecasting turning points before they occur.
Understanding this distinction helps set realistic expectations. No indicator can consistently predict the future, but a well-designed trend-following tool can help traders avoid fighting the market.
Why Trend Identification Matters in Trading
If you ask experienced traders what separates profitable trading from consistent losses, many will point to one principle: trade with the trend, not against it.
This advice may sound simple, but its importance cannot be overstated.
Imagine trying to paddle a small boat upstream against a strong current. Even if you make progress briefly, you are expending enormous effort fighting a force much larger than yourself. Trading against the market trend often produces a similar experience. You may occasionally succeed, but the odds are stacked against you.
Markets Move in Trends
Price movements generally fall into three broad categories:
| Market Condition | Description |
|---|---|
| Uptrend | Higher highs and higher lows |
| Downtrend | Lower highs and lower lows |
| Sideways Market | No clear direction |
The Super Trend Indicator is designed primarily for the first two scenarios, uptrends and downtrends. It excels when markets exhibit sustained directional movement.
Why Trends Exist
Trends develop because large institutional investors, such as mutual funds, pension funds, hedge funds, and insurance companies, cannot buy or sell massive positions instantly. Their activity unfolds over days, weeks, or even months, gradually pushing prices in one direction.
Retail traders who recognize these trends early have the opportunity to participate rather than compete against institutional flows.
The Cost of Ignoring the Trend
Consider two traders:
Trader A buys a stock because it “looks cheap,” even though the market is clearly declining.
Trader B waits until the Super Trend Indicator confirms that buyers have regained control before entering.
While Trader A may occasionally catch the exact bottom, Trader B is generally participating in higher-probability setups because the market has already demonstrated strength.
This illustrates an important lesson: successful trading is not about buying at the absolute lowest price. It is about participating in moves where probability favors your position.
Trend Following Is About Probability
The Super Trend Indicator does not guarantee success. Instead, it shifts the odds in your favor by encouraging decisions that align with prevailing market momentum.
Over hundreds of trades, consistently choosing higher-probability setups often produces better results than attempting to predict every reversal.
How the Super Trend Indicator Works
To appreciate the Super Trend Indicator fully, it is helpful to look beneath its clean visual appearance and understand the mechanics that drive it.
Although the indicator appears simple on a chart, it relies on an important concept in technical analysis: volatility.
The Role of ATR (Average True Range)
The Super Trend Indicator is built around the Average True Range (ATR), a volatility indicator developed by J. Welles Wilder Jr.
ATR measures how much price typically moves during a given period. Unlike trend indicators, ATR does not indicate direction. Instead, it measures the magnitude of price movement.
High ATR values indicate greater volatility.
Low ATR values indicate calmer market conditions.
The Super Trend Indicator uses this information to adjust its distance from the current price.
Why Volatility Matters
Suppose two stocks both rise by 5%.
One moves steadily over several weeks.
The other swings wildly up and down each day before finishing 5% higher.
Although both gained the same amount, the second stock involves significantly more risk. By incorporating ATR, the Super Trend Indicator adapts to these differences instead of using a fixed distance from price.
Dynamic Support and Resistance
Depending on the market direction, the Super Trend line acts like dynamic support or resistance.
During an uptrend:
- The line stays below price.
- It can act as a trailing stop.
- Traders often remain in the trade until price closes below it.
During a downtrend:
- The line shifts above price.
- It helps identify bearish momentum.
- It provides a reference point for potential exits on short positions.
Color Changes
Most charting platforms display:
- Green for bullish trends.
- Red for bearish trends.
These colors are not arbitrary. They visually reinforce whether buyers or sellers currently have the upper hand.
Rather than interpreting multiple oscillators, traders can glance at the chart and immediately understand the prevailing trend.
Understanding the Components of the Super Trend Indicator
Although the Super Trend Indicator appears as a single line on a chart, it is built from several interconnected components. Understanding each one helps traders use the indicator more effectively instead of treating it as a mysterious black box.
Average True Range (ATR)
ATR measures recent market volatility.
Higher ATR means:
- Larger daily price swings
- Wider stop-loss levels
- Greater uncertainty
Lower ATR means:
- Smaller price movements
- Tighter stops
- More stable trends
Multiplier
The multiplier determines how sensitive the indicator is.
A lower multiplier:
- Produces earlier signals
- Increases false signals
- Works well in strong trends
A higher multiplier:
- Produces fewer signals
- Filters out market noise
- May react later to reversals
Finding the right balance depends on the trader’s objectives and the market being traded.
Upper and Lower Bands
The indicator calculates upper and lower threshold levels based on ATR.
When price remains above the calculated level, the indicator maintains a bullish reading.
When price closes below the threshold, the indicator flips bearish.
This continuous recalculation allows the Super Trend Indicator to adapt dynamically rather than remaining static.
Buy and Sell Signals
The indicator typically generates:
Buy Signal
- Price closes above the Super Trend line.
- Indicator flips below price.
- Trend changes from bearish to bullish.
Sell Signal
- Price closes below the Super Trend line.
- Indicator flips above price.
- Trend changes from bullish to bearish.
These signals are intentionally simple, but simplicity should never be confused with certainty. Wise traders look for additional confirmation before committing capital.
Part II – Reading and Interpreting Signals
Now that we have established what the Super Trend Indicator is and how it works behind the scenes, it is time to focus on the skill that truly matters, interpreting its signals correctly.
Many beginners lose money not because the indicator is ineffective, but because they misunderstand what it is telling them. A green line does not automatically mean “buy,” just as a red line does not always mean “sell.” The context in which a signal appears is just as important as the signal itself.
Learning to read the Super Trend Indicator with context will help you filter out low-quality trades and focus on opportunities where the odds are more favorable.
How to Read the Super Trend Indicator Correctly
The Super Trend Indicator is one of the most visually intuitive indicators available. Unlike many technical tools that require interpreting multiple lines, histograms, or oscillators, it presents information in a simple format: a line that changes position and color based on the prevailing trend.
However, simplicity can be deceptive. Successful traders don’t merely react to every color change, they interpret the signal within the broader market context.
Understanding Bullish Signals
A bullish signal occurs when:
- The Super Trend line shifts below the price.
- The indicator changes from red to green (on most charting platforms).
- The price closes above the indicator.
This suggests that buyers have gained control and that the probability of an upward trend has increased.
Notice the wording: the probability has increased. It does not guarantee that prices will continue rising.
Professional traders rarely enter immediately after seeing a green signal. Instead, they ask several important questions:
- Is the overall market bullish?
- Is the stock making higher highs and higher lows?
- Has trading volume increased?
- Is the signal occurring near an important support level?
- Is the broader sector also strong?
When several factors align, the Super Trend signal becomes significantly more reliable.
Example
Imagine a stock has been falling for two weeks before stabilizing around a major support level. Gradually, buyers begin stepping in, volume increases, and the price closes above the Super Trend line for the first time.
This signal carries more weight than a random green flip occurring in a choppy, sideways market because multiple pieces of evidence point toward improving market sentiment.
Understanding Bearish Signals
Bearish signals follow the opposite principle.
A bearish signal appears when:
- Price closes below the Super Trend line.
- The indicator shifts above the candles.
- The color changes from green to red.
This suggests sellers are gaining control.
Again, professionals avoid acting solely on the indicator.
Instead, they evaluate questions such as:
- Is the broader market weakening?
- Has the stock broken below key support?
- Is selling volume increasing?
- Has market momentum slowed?
If these conditions align, the bearish signal becomes much more meaningful.
Trend Continuation vs. Trend Reversal
One of the most valuable uses of the Super Trend Indicator is not identifying reversals, it is helping traders stay invested during ongoing trends.
Many beginners exit winning trades far too early.
Suppose you buy a stock at $120.
It rises to $130.
Then $138.
Then $145.
Small pullbacks occur along the way.
A nervous trader may sell after every minor decline.
An experienced trend follower, however, notices that the Super Trend Indicator remains green throughout the pullbacks.
Instead of panicking, they remain patient because the overall trend remains intact.
This highlights one of the indicator’s greatest strengths:
It helps traders stay in winning trades longer.
As the old trading saying goes:
“The trend is your friend, until it ends.”
The Super Trend Indicator provides a systematic way to identify when that friendship may be ending.
Reading the Indicator in Different Market Conditions
The Super Trend Indicator performs differently depending on market conditions.
| Market Condition | Reliability |
|---|---|
| Strong Uptrend | Excellent |
| Strong Downtrend | Excellent |
| Gradual Trend | Very Good |
| High Volatility | Moderate |
| Sideways Market | Poor |
This table reveals an important truth:
The indicator is designed to follow trends, not predict them.
When the market lacks a clear direction, repeated color changes often produce false signals known as whipsaws.
One of the hallmarks of experienced traders is knowing when not to use an indicator.
Understanding Super Trend Buy Signals
Receiving a buy signal is exciting, especially for beginners eager to enter the market. However, successful trading is about disciplined decision-making, not emotional reactions.
Let’s examine what makes a high-quality buy signal.
Step 1: Confirm the Trend
The first question should always be:
Is the market actually trending upward?
Look for:
- Higher highs
- Higher lows
- Strong bullish candles
- Healthy volume
If price has simply oscillated sideways for several days, the signal deserves skepticism.
Step 2: Check Multiple Timeframes
Professional traders rarely rely on a single timeframe.
For example:
| Trading Style | Entry Chart | Confirmation Chart |
|---|---|---|
| Intraday | 5 min | 15 min |
| Swing Trading | Daily | Weekly |
| Position Trading | Weekly | Monthly |
Suppose the daily chart shows a fresh Super Trend buy signal.
If the weekly chart is also bullish, the trade gains additional credibility.
Multiple timeframe confirmation helps filter out weak setups.
Step 3: Look for Supporting Evidence
A Super Trend signal becomes stronger when supported by:
- Breakout above resistance
- Rising volume
- RSI above 50
- Positive MACD crossover
- Strong sector performance
No single indicator should be used in isolation.
Think of technical analysis like building a legal case. One piece of evidence may not be convincing, but several pieces pointing in the same direction strengthen the conclusion.
Step 4: Plan the Trade
Before entering, answer these questions:
- Where will I enter?
- Where is my stop-loss?
- What is my profit target?
- How much capital am I risking?
Entering first and planning later is one of the quickest paths to inconsistent results.
Example Trade
Imagine a technology stock trading around $210.
The Super Trend Indicator turns green after several weeks of consolidation.
Volume increases by 35%.
The stock breaks above resistance.
The broader technology sector is also strong.
Instead of buying impulsively, the trader waits for the next day’s confirmation candle before entering.
Their stop-loss is placed just below the Super Trend line, and they risk only 1% of their trading capital.
Whether the trade succeeds or fails, the decision-making process is disciplined and repeatable.
Understanding Super Trend Sell Signals
Selling is often emotionally harder than buying.
Greed encourages traders to hold winning positions indefinitely, while fear pushes them to exit losing trades too late.
The Super Trend Indicator provides objective criteria for exits.
Recognizing Genuine Weakness
A bearish flip becomes more meaningful when accompanied by:
- Lower highs
- Lower lows
- Increasing selling volume
- Breakdown below support
- Weak market sentiment
When several bearish factors align, the probability of further downside increases.
Avoid Premature Exits
One common mistake is exiting after every small pullback.
Healthy trends naturally experience temporary corrections.
If the Super Trend line remains bullish, exiting solely because of a minor decline may result in missing a much larger move.
Patience is often one of the most profitable trading skills.
Trailing Stop Strategy
Many traders use the Super Trend Indicator as a trailing stop.
For example:
Entry Price: $85
Current Price: $112
Instead of selling immediately, they continue holding as long as the price remains above the Super Trend line.
If the price eventually closes below the indicator, the position is exited automatically.
This systematic approach removes much of the emotional stress associated with deciding when to sell.
Example Exit
Suppose a stock rises from $95 to $128 over several weeks.
Near the end of the rally:
- Volume begins declining.
- Momentum weakens.
- Price closes below the Super Trend line.
- The indicator flips red.
Instead of hoping for another rally, the trader follows their trading plan and exits.
The goal is not to sell at the exact top.
The goal is to capture the majority of the trend while protecting profits.
Choosing the Best Super Trend Settings
One of the most frequently asked questions is:
“What are the best Super Trend settings?”
The honest answer is:
There is no universal setting that works for every market, timeframe, or trading style.
However, understanding the purpose of each parameter helps you make informed adjustments.
Default Settings
Most charting platforms use:
- ATR Period: 10
- Multiplier: 3
These settings strike a balance between responsiveness and stability.
For many traders, they serve as an excellent starting point.
Understanding the Trade-Off
Changing the settings affects how quickly the indicator reacts.
| Lower Values | Higher Values |
|---|---|
| Faster signals | Slower signals |
| More trades | Fewer trades |
| More false signals | Better filtering |
| Higher sensitivity | Lower sensitivity |
There is always a trade-off between responsiveness and reliability.
Recommended Settings by Trading Style
| Trading Style | ATR | Multiplier |
|---|---|---|
| Scalping | 7–10 | 2–2.5 |
| Intraday | 10 | 3 |
| Swing Trading | 10–14 | 3 |
| Positional Trading | 14 | 3–4 |
| Long-Term Investing | 14–20 | 4 |
These are guidelines rather than fixed rules. The optimal settings depend on the volatility of the asset and your risk tolerance.
Should Beginners Change the Settings?
Generally, no.
Many beginners spend excessive time searching for the “perfect” settings, believing they will eliminate losing trades.
In reality, success depends far more on:
- Risk management
- Discipline
- Position sizing
- Patience
- Consistent execution
than on minor parameter adjustments.
Start with the defaults, gain experience, and only then experiment with different configurations based on backtesting.
Best Practice: Backtest Before You Modify
Before changing any setting, test it over historical data.
Ask yourself:
- Does it improve win rate?
- Does it reduce false signals?
- Does it fit my trading style?
- Does it improve the risk-reward profile?
A setting that performs well on one stock may perform poorly on another.
Evidence should guide adjustments, not intuition alone.
Step-by-Step Guide to Trading with the Super Trend Indicator
Understanding an indicator is one thing, using it consistently in live markets is another. A structured workflow reduces impulsive decisions and helps maintain discipline.
Step 1: Choose the Right Market
Begin with assets that are showing a clear trend. The Super Trend Indicator works best in markets with sustained directional movement rather than prolonged sideways consolidation.
Look for:
- Stocks making higher highs and higher lows (for long trades)
- Stocks making lower highs and lower lows (for short trades, where permitted)
- Healthy trading volume
- Clear price structure
Avoid forcing trades in markets that lack direction.
Step 2: Apply the Indicator
On your charting platform:
- Add the Super Trend Indicator
- Start with the default settings (ATR 10, Multiplier 3)
- Observe whether the indicator is above or below the price
Don’t rush into a trade the moment you apply it. Spend time observing how it has behaved over recent weeks to understand the character of the asset.
Step 3: Wait for Confirmation
When the indicator changes direction:
- Check whether the price has broken an important support or resistance level.
- Review trading volume.
- Confirm the signal on a higher timeframe.
- Ensure the broader market aligns with your trade direction.
Patience often separates consistent traders from impulsive ones.
Step 4: Plan Your Risk
Before entering, define:
- Entry price
- Stop-loss (often just beyond the Super Trend line or a recent swing point)
- Profit target
- Maximum percentage of capital to risk
Many experienced traders risk only a small fraction of their capital on any single trade. This helps them withstand inevitable losing streaks.
Step 5: Manage the Trade
Once in the trade:
- Avoid reacting to every small price fluctuation.
- Let the Super Trend Indicator help you stay aligned with the broader trend.
- Consider using it as a dynamic trailing stop rather than moving your stop-loss emotionally.
Remember, no indicator removes uncertainty. Your objective is to execute your plan consistently, not to predict every market move.
Part III – Practical Application and Real-World Usage
By now, you understand what the Super Trend Indicator is, how it works, and how to interpret its buy and sell signals. However, one important lesson separates consistently profitable traders from those who struggle:
An indicator should never be used in isolation.
Think of the Super Trend Indicator as the captain of a ship. It provides direction, but it still relies on navigation charts, weather reports, and radar to reach the destination safely. Similarly, combining the Super Trend Indicator with other forms of technical analysis can significantly improve the quality of your trading decisions.
Let’s explore how experienced traders use the Super Trend Indicator as part of a complete trading framework.
Combining the Super Trend Indicator with Other Indicators
No single technical indicator works perfectly in every market condition. Each has strengths and weaknesses. The goal is not to find a “perfect” indicator but to combine complementary tools that confirm one another.
Super Trend + Moving Averages
Moving averages are among the oldest and most widely used trend indicators. They smooth price fluctuations and reveal the underlying direction of the market.
A simple yet effective approach is to use the:
- 50-day Moving Average
- 200-day Moving Average
Trading Strategy
Consider long trades when:
- The price is above both moving averages.
- The Super Trend Indicator turns bullish.
- The moving averages themselves are sloping upward.
This combination helps ensure that you are trading with both the short-term and long-term trend.
Why It Works
The moving averages establish the broader trend, while the Super Trend Indicator provides more timely entry and exit signals.
Super Trend + RSI (Relative Strength Index)
The Relative Strength Index measures momentum rather than trend.
While the Super Trend tells you where the market is moving, RSI helps determine whether momentum supports that move.
Example
A bullish setup becomes stronger when:
- Super Trend turns green.
- RSI rises above 50.
- RSI is not yet above 70 (extremely overbought).
Likewise, bearish trades gain confidence when:
- Super Trend turns red.
- RSI falls below 50.
This combination reduces the likelihood of entering trades after the majority of the move has already occurred.
Super Trend + MACD
The Moving Average Convergence Divergence (MACD) measures trend momentum.
Many swing traders prefer combining MACD with Super Trend because they complement one another well.
High-Probability Bullish Setup
- Super Trend flips bullish.
- MACD crosses above its signal line.
- MACD histogram begins expanding.
- Price breaks above recent resistance.
Multiple confirmations increase confidence without guaranteeing success.
Super Trend + Volume
Volume is often described as the fuel behind price movement.
Imagine a stock breaking above resistance with very little trading activity.
Would you trust the breakout?
Probably not.
Now imagine another breakout accompanied by trading volume twice the recent average.
Institutional participation is much more likely.
Whenever possible, allow volume to confirm Super Trend signals.
Super Trend + Support and Resistance
Support and resistance remain fundamental concepts in technical analysis.
A Super Trend buy signal occurring exactly at a long-established support zone is generally more meaningful than one appearing in the middle of a random trading range.
Similarly:
A bearish Super Trend signal becomes stronger if it occurs immediately after price fails to break above an important resistance level.
The best trades often occur when multiple technical concepts align.
Super Trend + Price Action
Professional traders frequently place greater emphasis on price action than on indicators.
The Super Trend Indicator becomes considerably more powerful when combined with candlestick analysis.
Look for bullish formations such as:
- Bullish engulfing candles
- Hammer patterns
- Morning stars
- Strong breakout candles
Likewise, bearish patterns like shooting stars or bearish engulfing formations can reinforce bearish Super Trend signals.
Indicators summarize market behavior.
Price action reveals it directly.
A Simple Confluence Checklist
Before entering a trade, ask yourself:
✔ Is the Super Trend signal aligned with the overall trend?
✔ Is price above (or below) key moving averages?
✔ Does RSI support the direction?
✔ Is volume confirming the move?
✔ Has price respected important support or resistance?
✔ Does the candlestick pattern strengthen the setup?
The more boxes you can check, the stronger the trade setup generally becomes.
Which Timeframe Works Best?
One of the most common misconceptions among beginners is that there is a single “best” timeframe for every indicator.
In reality, the best timeframe depends entirely on your trading style, available time, and objectives.
The Super Trend Indicator performs differently across various timeframes because market noise changes as the timeframe changes.
5-Minute Chart
Suitable for:
- Scalpers
- Active intraday traders
Advantages:
- Numerous trading opportunities
- Fast entries and exits
Disadvantages:
- More false signals
- Higher emotional pressure
- Requires constant monitoring
This timeframe is generally not recommended for beginners.
15-Minute Chart
Many day traders consider this a practical compromise.
Benefits include:
- Less market noise than the 5-minute chart
- Better trend definition
- More reliable signals
If you are new to intraday trading, this timeframe often provides a smoother learning experience.
Hourly Chart
The hourly timeframe suits traders who prefer holding positions for one to several days.
Advantages include:
- Higher-quality trends
- Fewer false signals
- More time for decision-making
Many swing traders monitor the hourly chart for entries while confirming the broader trend using the daily chart.
Daily Chart
For many investors and swing traders, the daily chart offers the best balance between reliability and practicality.
Advantages:
- Reduced market noise
- Stronger trends
- Better signal quality
- Lower emotional stress
Because each candle represents an entire trading day, temporary intraday fluctuations have less influence.
This is one reason many professional traders recommend that beginners start with daily charts.
Weekly Chart
Weekly charts are ideal for:
- Long-term investors
- Position traders
- Portfolio managers
Signals appear less frequently but often represent major market trends.
Patience becomes more important than activity.
Multi-Timeframe Analysis
Rather than relying on a single timeframe, experienced traders often combine several.
For example:
| Trading Style | Entry Chart | Confirmation Chart |
|---|---|---|
| Intraday | 15-minute | Hourly |
| Swing Trading | Daily | Weekly |
| Position Trading | Weekly | Monthly |
The principle is simple:
Use the larger timeframe to identify the trend.
Use the smaller timeframe to fine-tune entries.
This approach reduces the chances of trading against the broader market direction.
Where the Super Trend Indicator Performs Best
The Super Trend Indicator is versatile enough to be applied across many financial markets. However, its effectiveness depends largely on whether the market is trending.
Let’s examine how it behaves in different asset classes.
Stocks
Stocks are perhaps the most common application.
The indicator performs particularly well in:
- Large-cap stocks
- Momentum stocks
- Sector leaders
Stocks that trend steadily often produce cleaner Super Trend signals than highly speculative securities.
Exchange-Traded Funds (ETFs)
ETFs frequently exhibit smoother price movements than individual stocks because they represent baskets of securities.
This reduced volatility can improve the quality of Super Trend signals.
Examples include:
- Broad market ETFs
- Sector ETFs
- Index-tracking funds
Index Trading
Major stock indices often trend for extended periods due to broad economic forces.
Examples include:
- S&P 500
- Nasdaq-100
- Nifty 50
- Sensex
The Super Trend Indicator can help traders remain aligned with these larger market movements rather than reacting to daily news.
Commodities
Commodities frequently experience prolonged trends driven by supply and demand dynamics.
Examples include:
- Gold
- Silver
- Crude Oil
- Natural Gas
Because volatility can increase significantly in commodity markets, careful risk management becomes especially important.
Forex
Currency markets often display sustained trends influenced by:
- Interest rates
- Inflation
- Economic growth
- Central bank policies
The Super Trend Indicator works well during directional currency moves but may generate more false signals during low-volatility periods.
Cryptocurrencies
Cryptocurrency markets are known for their extreme volatility.
Strong trends can produce excellent Super Trend signals.
However:
Rapid price swings can also trigger repeated false reversals.
Many cryptocurrency traders compensate by:
- Using higher timeframes
- Increasing the ATR multiplier
- Combining Super Trend with volume analysis
Choosing the Right Market
Regardless of the asset class, ask yourself:
- Is the market trending?
- Is liquidity sufficient?
- Is volatility appropriate for my strategy?
- Do I understand the factors driving this market?
Remember:
The Super Trend Indicator follows trends.
It cannot create trends where none exist.
Strengths of the Super Trend Indicator
Every technical indicator has advantages and disadvantages.
Understanding both prevents unrealistic expectations.
Let’s begin with the strengths that have made the Super Trend Indicator one of the most widely used trend-following tools.
1. Easy to Understand
Many technical indicators overwhelm beginners with multiple calculations and complex interpretations.
The Super Trend Indicator simplifies decision-making by providing a clear visual representation of market direction.
This makes it an excellent educational tool for new traders.
2. Excellent Trend Filter
One of the most valuable habits in trading is avoiding unnecessary trades.
The Super Trend Indicator naturally filters out many low-probability setups by encouraging traders to stay aligned with the prevailing trend.
Instead of constantly buying and selling, traders learn patience.
3. Dynamic Stop-Loss
Unlike fixed stop-loss levels, the Super Trend Indicator adjusts automatically as prices move.
This allows traders to:
- Protect profits
- Give trends room to develop
- Remove much of the emotion from exit decisions
4. Adaptable to Volatility
Because it incorporates the Average True Range (ATR), the indicator automatically adjusts to changing market conditions.
During volatile periods, it provides wider breathing room.
During calmer periods, it follows price more closely.
5. Works Across Multiple Markets
Whether you are trading:
- Stocks
- ETFs
- Indices
- Commodities
- Forex
- Cryptocurrencies
the underlying principles remain largely the same.
This consistency makes learning the indicator particularly worthwhile.
6. Encourages Discipline
Perhaps the greatest benefit is psychological rather than mathematical.
The Super Trend Indicator encourages traders to follow predefined rules instead of reacting emotionally to every market fluctuation.
Consistency often matters more than complexity.
Part IV – Risk Management, Common Mistakes, and Professional Insights
By this point, you understand how the Super Trend Indicator works, how to interpret its signals, and how to combine it with other technical tools. However, there is an important reality that every trader eventually discovers:
A profitable trading career is built less on finding perfect entries and more on managing imperfect trades.
Even the best traders experience losing trades. The difference is that they control their losses, protect their capital, and let profitable trades develop naturally. This section explores how to use the Super Trend Indicator within a disciplined risk management framework while avoiding the common mistakes that prevent many beginners from becoming consistently successful.
Limitations You Must Understand
The Super Trend Indicator is a powerful trend-following tool, but it is not infallible. Understanding its weaknesses allows you to use it intelligently instead of expecting it to solve every trading problem.
1. It Is a Lagging Indicator
Like moving averages, the Super Trend Indicator is based on historical price data. It reacts to price movements after they occur rather than predicting them.
This means:
- You may enter after part of the move has already happened.
- You may exit after some profits have already been given back.
- You won’t consistently buy at the exact bottom or sell at the exact top.
This is not a flaw, it is the nature of trend-following strategies. Their objective is to capture the middle portion of a trend, where probabilities are generally more favorable.
2. False Signals in Sideways Markets
The biggest weakness of the Super Trend Indicator appears when the market lacks a clear direction.
In a range-bound market:
- Price repeatedly crosses above and below the indicator.
- Buy and sell signals alternate rapidly.
- Multiple losing trades may occur in succession.
This phenomenon is known as whipsaw.
Example
Imagine a stock trading between $98 and $102 for three weeks.
During this period:
- The indicator turns green.
- Two days later it turns red.
- Then green again.
- Then red again.
None of these signals represent a genuine trend. They simply reflect short-term price fluctuations.
One of the easiest ways to reduce whipsaws is to avoid trading when price is trapped inside a well-defined range.
3. Sensitive Settings Can Increase Noise
Many beginners reduce the ATR period or multiplier in the hope of receiving earlier signals.
Earlier signals often come at a cost:
- More trades
- More false signals
- Higher commission costs
- Increased emotional stress
Remember:
More trades do not necessarily lead to higher profits.
Quality is almost always more important than quantity.
4. It Cannot Replace Market Analysis
Some traders make the mistake of believing that the Super Trend Indicator alone is sufficient.
Successful trading requires considering multiple factors:
- Overall market trend
- Sector strength
- Support and resistance
- Volume
- Risk management
- Economic events
- Company-specific news (for stocks)
The indicator is one valuable input, not a complete trading system.
5. Performance Varies Across Assets
Not all securities trend equally.
For example:
- A steadily trending index ETF may produce clean signals.
- A thinly traded penny stock may generate erratic and unreliable signals.
Before relying on any indicator, understand the behavior of the asset you are trading.
Common Mistakes Beginners Make
Every experienced trader has made mistakes. The goal is not to avoid every error but to recognize and correct them before they become expensive habits.
Mistake 1: Treating Every Signal as a Trade
Seeing the indicator change color does not automatically create a trading opportunity.
Instead, ask:
- Is the broader trend supportive?
- Is volume confirming?
- Is the market trending?
- Does the trade offer an acceptable risk-reward ratio?
Professional traders filter signals. Beginners often react to every one.
Mistake 2: Ignoring Risk Management
A common misconception is:
“If the indicator is accurate, I don’t need to worry about risk.”
Nothing could be further from the truth.
Even an excellent trading strategy experiences losing trades.
Protecting capital ensures that one bad trade does not jeopardize your ability to participate in the next opportunity.
Mistake 3: Constantly Changing Settings
Many traders fall into the trap of “indicator optimization.”
After a losing trade:
- They change the ATR.
- Then the multiplier.
- Then the timeframe.
Soon, they are testing dozens of combinations without ever mastering one.
Consistency produces better learning than constant experimentation.
Mistake 4: Trading Against the Higher Timeframe
Suppose:
- The weekly trend is strongly bearish.
- The daily chart shows a temporary bullish Super Trend signal.
Buying in this situation may mean trading against the dominant trend.
Higher timeframe trends deserve respect because they often reflect institutional positioning.
Mistake 5: Overtrading
Some traders feel they must always have an open position.
Professional traders understand something different:
Sometimes the best trade is no trade.
Waiting patiently for high-quality setups often improves long-term performance.
Mistake 6: Letting Emotions Override the Plan
Consider this familiar scenario:
The Super Trend Indicator signals an exit.
Instead of selling, the trader thinks:
“It will probably recover tomorrow.”
Tomorrow becomes next week.
The loss grows.
Eventually, a small manageable loss becomes a significant one.
Indicators cannot eliminate emotions, but following predefined rules can reduce their influence.
Risk Management When Using the Super Trend Indicator
Risk management is the foundation upon which every sustainable trading strategy is built.
Without it, even an excellent indicator cannot protect you from poor decisions.
Position Sizing
Before entering any trade, determine:
- How much capital you are willing to risk.
- The distance between your entry and stop-loss.
Example:
Trading account: $20,000
Maximum risk per trade: 1%
Maximum dollar risk: $200
If your stop-loss is $4 below your entry price, you can calculate an appropriate position size that limits your loss to your predetermined amount.
Notice that the position size is determined by risk, not by excitement or confidence.
Use Logical Stop-Loss Placement
Many traders use the Super Trend line itself as a reference.
Others place the stop-loss:
- Below the recent swing low (for long trades)
- Above the recent swing high (for short trades)
Avoid placing stops at arbitrary distances.
They should reflect market structure rather than guesswork.
Maintain a Favorable Risk-Reward Ratio
Before entering a trade, compare:
Potential reward versus potential risk.
For example:
| Risk | Potential Reward | Ratio |
|---|---|---|
| $100 | $200 | 1:2 |
| $100 | $300 | 1:3 |
| $100 | $500 | 1:5 |
Even if only half your trades are profitable, favorable risk-reward ratios can still produce positive long-term results.
Accept That Losses Are Part of Trading
Every professional trader experiences losses.
The objective is not perfection.
The objective is consistency.
Small planned losses are business expenses.
Large emotional losses are usually avoidable.
Trading Psychology and the Super Trend Indicator
Many books on technical analysis focus heavily on indicators while giving little attention to psychology. Yet experienced traders often argue that psychology is the deciding factor between long-term success and repeated frustration.
The Super Trend Indicator provides clear signals, but it cannot make decisions for you. Human emotions still play a significant role.
Fear of Missing Out (FOMO)
Imagine watching a stock rise 15% over three days.
You did not buy.
Suddenly the Super Trend Indicator turns green.
Instead of evaluating the setup objectively, you rush into the trade because you are afraid of missing further gains.
Unfortunately, the stock soon pulls back.
The problem was not the indicator, it was the emotional decision.
Exiting Winners Too Early
Many traders become nervous once a trade shows a modest profit.
They think:
“I should lock in this gain before it disappears.”
Meanwhile, the Super Trend Indicator continues to show a healthy uptrend.
Learning to trust a well-tested trading plan often allows profitable trades to develop further.
Holding Losing Trades Too Long
Hope is not a trading strategy.
When the indicator signals an exit and your stop-loss is reached, accepting the loss allows you to preserve capital for future opportunities.
Develop Rules Before Entering
Professional traders answer these questions before opening a position:
- Why am I entering?
- Where will I exit if I am wrong?
- Where will I take profits?
- How much am I risking?
- Does this trade fit my plan?
When decisions are made in advance, emotions have fewer opportunities to interfere.
What Experts Do Differently
One of the biggest differences between beginners and experienced traders is not intelligence, it is process.
Experts understand that trading is a game of probabilities rather than certainty.
They Wait for Confluence
Rather than relying on one indicator, professionals seek multiple factors pointing in the same direction.
A high-quality setup might include:
- Bullish Super Trend signal
- Breakout above resistance
- Rising volume
- RSI above 50
- Positive MACD crossover
- Strong overall market trend
Each additional confirmation improves confidence, although it never eliminates risk.
They Think in Probabilities
Professionals rarely say:
“This trade will definitely work.”
Instead, they think:
“This setup has favorable odds based on my experience and rules.”
This subtle shift in mindset reduces emotional attachment to individual trades.
They Keep Trading Journals
After every trade, they record:
- Entry reason
- Exit reason
- Risk-reward ratio
- Emotional state
- Lessons learned
Over time, this journal becomes one of their most valuable educational resources.
They Protect Capital First
Experienced traders know:
Capital is inventory.
Without capital, future opportunities become irrelevant.
Their first priority is survival.
Profit comes second.
They Value Consistency Over Excitement
Many beginners seek excitement.
Professionals seek repeatability.
A strategy that produces modest but consistent results is generally more valuable than one that delivers occasional spectacular gains followed by significant losses.
Beginner, Intermediate, and Advanced Approaches
Your use of the Super Trend Indicator should evolve as your knowledge and experience grow.
Beginner Approach
Focus on simplicity.
- Use default settings.
- Trade only in the direction of the daily trend.
- Combine the indicator with support and resistance.
- Risk no more than a small percentage of your account per trade.
- Keep a basic trading journal.
Your goal at this stage is to build consistency rather than maximize returns.
Intermediate Approach
Once you gain confidence:
- Add RSI or MACD for confirmation.
- Use multi-timeframe analysis.
- Backtest different settings on your preferred market.
- Refine your entry and exit rules.
- Evaluate your performance monthly.
Advanced Approach
Experienced traders often integrate the Super Trend Indicator into a broader trading system.
This may include:
- Market structure analysis
- Sector rotation
- Volume profile
- Institutional order flow concepts
- Statistical performance tracking
- Portfolio-level risk management
At this level, the indicator is one component of a comprehensive decision-making framework rather than the primary driver of every trade.
Part V – Advanced Applications, Case Studies, and Final Thoughts
Now that you have learned how the Super Trend Indicator works, how to interpret its signals, and how to manage risk, it is time to bring everything together. Technical analysis is most valuable when theory meets practice. The following sections demonstrate how experienced traders think, compare the Super Trend Indicator with other popular tools, and summarize the essential lessons from this guide.
Real-World Case Studies
Studying real trading scenarios helps bridge the gap between understanding an indicator and applying it confidently.
Case Study 1: Riding a Strong Uptrend
Scenario
A large-cap technology stock has been trading in a steady uptrend for several months.
Characteristics include:
- Higher highs
- Higher lows
- Rising trading volume
- Strong sector performance
The Super Trend Indicator changes from bearish to bullish shortly after the stock breaks above an important resistance level.
Trading Plan
The trader:
- Waits for the daily candle to close above resistance.
- Confirms that the weekly chart is also bullish.
- Places a stop-loss below the recent swing low.
- Risks only 1% of total trading capital.
Outcome
Over the next six weeks:
- The stock advances approximately 18%.
- The Super Trend line remains below price.
- Minor pullbacks occur but never invalidate the trend.
Instead of exiting at the first sign of weakness, the trader uses the Super Trend line as a trailing stop and captures most of the move.
Lesson
The biggest profits often come from staying with strong trends, not from trying to predict every short-term fluctuation.
Case Study 2: The Sideways Market Trap
Scenario
Another stock spends four weeks moving between well-defined support and resistance.
During this period:
- The Super Trend flips multiple times.
- Buy and sell signals alternate frequently.
- Price fails to establish a sustained direction.
Outcome
A trader who follows every signal accumulates several small losses.
A more experienced trader recognizes the lack of trend and waits patiently for a confirmed breakout before taking action.
Lesson
Sometimes the best trade is no trade. Trend-following indicators are designed for trending markets, not prolonged consolidation.
Case Study 3: The False Breakout
Scenario
A stock breaks above resistance, and the Super Trend turns bullish.
However:
- Trading volume is unusually low.
- The broader market is weakening.
- Momentum indicators fail to confirm the breakout.
Within two trading sessions, the price falls back into the previous range, and the Super Trend reverses.
Lesson
The indicator provided a signal, but the surrounding evidence did not support it. Confluence matters. Waiting for confirmation from volume, market structure, and broader market conditions can help reduce the impact of false breakouts.
Super Trend Indicator vs. Other Trend Indicators
No indicator is universally superior. Each is designed with a different objective. Understanding these differences helps you choose the right tool for your trading style.
| Feature | Super Trend | Moving Average | Parabolic SAR | Donchian Channels | Ichimoku Cloud |
|---|---|---|---|---|---|
| Ease of Use | Excellent | Excellent | Good | Good | Moderate to Advanced |
| Trend Detection | Excellent | Good | Good | Excellent | Excellent |
| Entry Signals | Clear | Moderate | Clear | Moderate | Strong |
| Exit Signals | Excellent | Moderate | Good | Moderate | Strong |
| Sideways Markets | Weak | Weak | Weak | Moderate | Moderate |
| Beginner Friendly | Yes | Yes | Yes | Moderate | Less Beginner Friendly |
Super Trend vs. Moving Averages
Moving averages provide a smooth representation of the prevailing trend but react slowly to changing market conditions.
The Super Trend Indicator incorporates volatility through the Average True Range (ATR), allowing it to adapt more dynamically.
Best use:
- Moving averages define the broader trend.
- Super Trend refines trade entries and exits.
Super Trend vs. Parabolic SAR
Parabolic SAR focuses primarily on identifying trend reversals.
Advantages of Super Trend:
- Produces fewer false reversals during sustained trends.
- Offers more adaptable stop-loss placement.
- Better reflects changes in volatility.
Super Trend vs. Donchian Channels
Donchian Channels identify breakouts by tracking the highest highs and lowest lows over a selected period.
While Donchian Channels excel at breakout strategies, the Super Trend Indicator often provides cleaner guidance for managing an existing trend.
Super Trend vs. Ichimoku Cloud
The Ichimoku Cloud offers an exceptionally comprehensive view of market structure.
It includes:
- Trend direction
- Momentum
- Support and resistance
- Future projections
However, many beginners find it visually complex.
The Super Trend Indicator sacrifices some complexity in favor of clarity and ease of interpretation.
Which One Should You Choose?
The answer depends on your goals.
If you want:
- Simplicity
- Clear trend visualization
- Straightforward entry and exit signals
- Dynamic trailing stops
then the Super Trend Indicator is an excellent choice.
If you require deeper market analysis, combining it with complementary tools may provide a more complete picture.
Key Takeaways
Before moving to the conclusion, let’s summarize the most important lessons from this guide.
Understanding
- The Super Trend Indicator is a trend-following, not a predictive, indicator.
- It is based on the Average True Range (ATR), making it responsive to market volatility.
- It performs best during sustained trends.
Trading
- Never trade every signal blindly.
- Confirm signals using market structure, volume, and higher timeframes.
- Avoid relying on the indicator in prolonged sideways markets.
Risk Management
- Always define your stop-loss before entering.
- Risk only a small percentage of your capital on each trade.
- Maintain favorable risk-reward ratios.
- Accept losses as a normal part of trading.
Professional Mindset
- Think in probabilities rather than certainties.
- Keep a trading journal.
- Focus on consistency rather than excitement.
- Let your trading plan, not your emotions, guide your decisions.
Quick Trading Checklist
Before entering a trade, ask yourself:
☐ Is the overall market trending?
☐ Does the Super Trend align with the higher timeframe?
☐ Is volume confirming the move?
☐ Has price respected key support or resistance?
☐ Is my stop-loss clearly defined?
☐ Does the trade offer an attractive risk-reward ratio?
☐ Am I following my trading plan rather than reacting emotionally?
If several of these answers are “No,” consider waiting for a better opportunity.
Conclusion
The Super Trend Indicator has earned its popularity because it simplifies one of the most challenging aspects of trading: identifying the direction of the market. By combining price action with volatility through the Average True Range, it provides a practical framework for recognizing trends, managing trades, and controlling risk.
Yet its greatest value lies not in generating buy and sell signals but in encouraging discipline. Markets are inherently uncertain, and no indicator can eliminate that uncertainty. What the Super Trend Indicator can do is help you make decisions based on objective rules rather than emotion.
Throughout this guide, we have explored how the indicator works, where it performs best, how to combine it with other technical tools, and why risk management is just as important as finding a good entry. We have also seen that successful traders think in probabilities, remain patient during uncertain markets, and protect their capital before pursuing profits.
As you begin using the Super Trend Indicator, resist the temptation to search for perfect settings or flawless signals. Instead, focus on building a repeatable process. Practice on historical charts, maintain a trading journal, review your decisions regularly, and refine your approach based on evidence rather than emotion.
Over time, these habits, not any single indicator, will contribute most to your growth as a trader.
If you found this guide helpful, consider sharing it with others who may benefit.
Frequently Asked Questions (FAQs)
1. What is the Super Trend Indicator?
The Super Trend Indicator is a trend-following technical analysis tool that uses the Average True Range (ATR) to identify the prevailing market trend and generate potential buy and sell signals. It appears directly on the price chart and changes position when the trend shifts.
2. Is the Super Trend Indicator good for beginners?
Yes. Its clear visual design makes it one of the easiest trend-following indicators to understand. However, beginners should avoid relying on it alone and should combine it with sound risk management and basic chart analysis.
3. What are the best Super Trend settings?
The most common default settings are:
- ATR Period: 10
- Multiplier: 3
These settings work well for many markets, but the optimal configuration depends on the asset, timeframe, and trading style. Backtesting is recommended before making adjustments.
4. Does the Super Trend Indicator repaint?
No. Once a candle has closed and the signal is confirmed, the Super Trend Indicator does not repaint historical values. However, during an open candle, the indicator’s position may change as price moves.
5. Can the Super Trend Indicator be used for intraday trading?
Yes. Many intraday traders use it on 5-minute, 15-minute, or hourly charts. Because lower timeframes contain more market noise, it’s helpful to confirm signals using a higher timeframe and additional indicators.
6. Which timeframe is best for the Super Trend Indicator?
There is no single best timeframe.
- Intraday traders often use 15-minute and hourly charts.
- Swing traders frequently rely on daily charts.
- Position traders typically prefer weekly charts.
Daily charts are often the best starting point for beginners because they reduce short-term noise.
7. Can the Super Trend Indicator be used alone?
While it can be used by itself, relying solely on any indicator is not recommended. Combining the Super Trend Indicator with price action, support and resistance, volume, and momentum indicators generally leads to more informed trading decisions.
8. Is the Super Trend Indicator better than moving averages?
Not necessarily. Moving averages excel at identifying long-term trends, while the Super Trend Indicator provides more responsive entry and exit signals by incorporating market volatility. Many traders use both together rather than choosing one over the other.
9. How accurate is the Super Trend Indicator?
Its accuracy depends on market conditions. It performs well during strong trends but may generate false signals during sideways or highly choppy markets. No indicator is consistently accurate under all conditions.
10. How can I reduce false Super Trend signals?
You can improve signal quality by:
- Trading only in trending markets.
- Confirming signals with higher timeframes.
- Using volume analysis.
- Identifying key support and resistance levels.
- Combining the indicator with complementary tools such as RSI or MACD.
- Following a disciplined risk management plan.